Product
Market breadth dashboard for the whole US tape
Track 4% movers, advance-decline, new highs vs lows, and stocks above key moving averages across ~12,000 US stocks — with 20 years of history.
Start 14-day free trial See pricing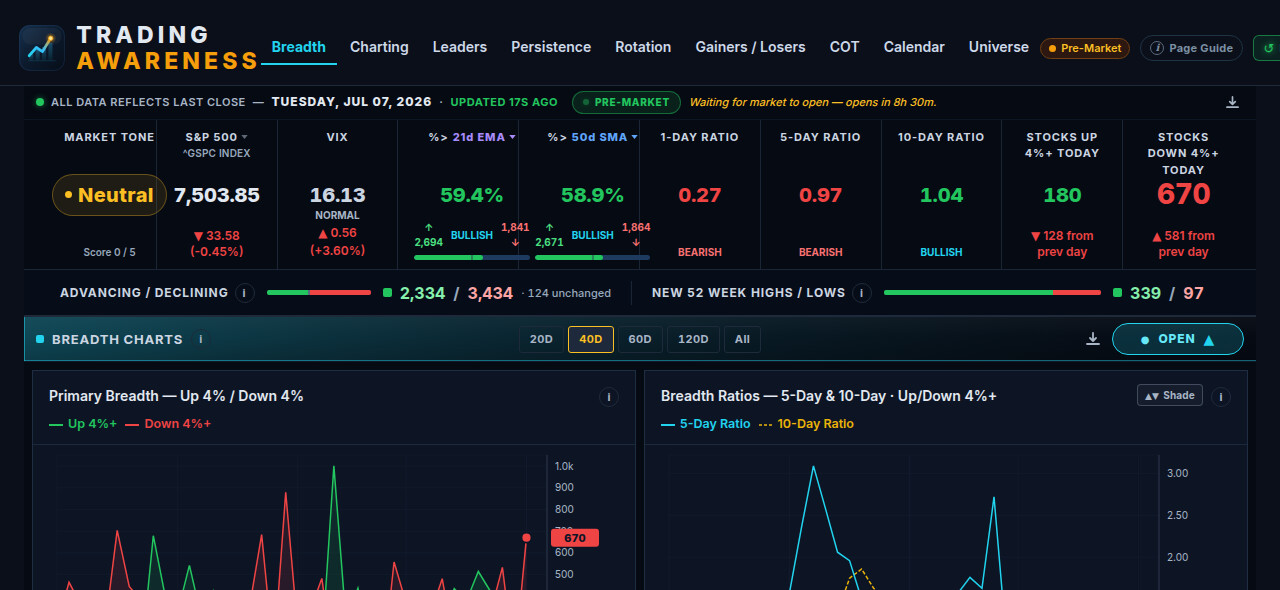
What you get
Mechanical 4%+ up/down counts and ratio views that show whether the tape is expanding or contracting.
Compare today's breadth to prior cycles instead of reacting to a single headline day.
Scan the breadth heatmap, then drill into the time series alongside Leaders and Rotation.
Go deeper
Prefer a walkthrough? Read the market breadth guide.
FAQ
What is market breadth?
Breadth measures how many stocks participate in a move — advances vs declines, new highs vs lows, percent above moving averages.
How is this different from Finviz?
Finviz is primarily a screener and map. WideRadar centres on daily breadth, leadership ranking and charting with verdicts.
Do I need StockBee education to use it?
No. The dashboard automates the counts; learn guides explain the methodology if you want the theory.