Is the stock market in an uptrend today?
An advanced charting workstation
with leading market breadth
Live charts, buy/sell verdicts, and StockBee-style breadth across ~12,000 US stocks — price and internals in one workspace.
14-day free trial · Cancel anytime · You won't be charged until the trial ends
Charting · Market breadth · Leaders · Rotation
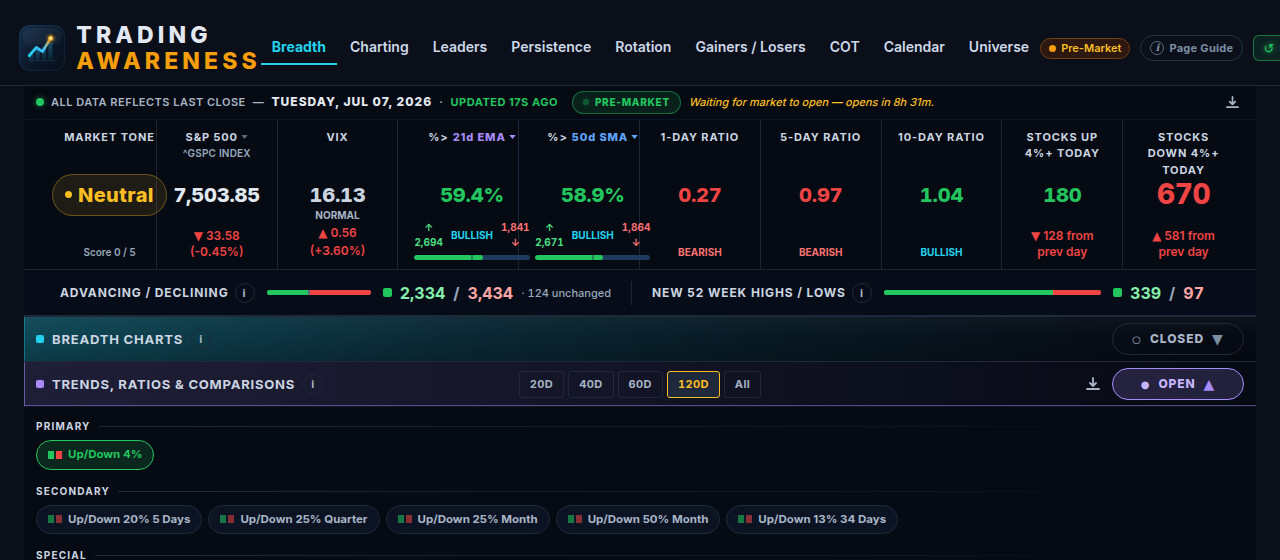
Live from the Breadth tab — today's read on the whole US tape, no signup required
Live market breadth
See today’s breadth verdict across ~12,000 US stocks — % above the 50-day, advancers/decliners, 4% movers, and more.
% above 50-day SMA — share of the US stock universe trading above its 50-day moving average. The classic read on whether participation is broad or thinning.
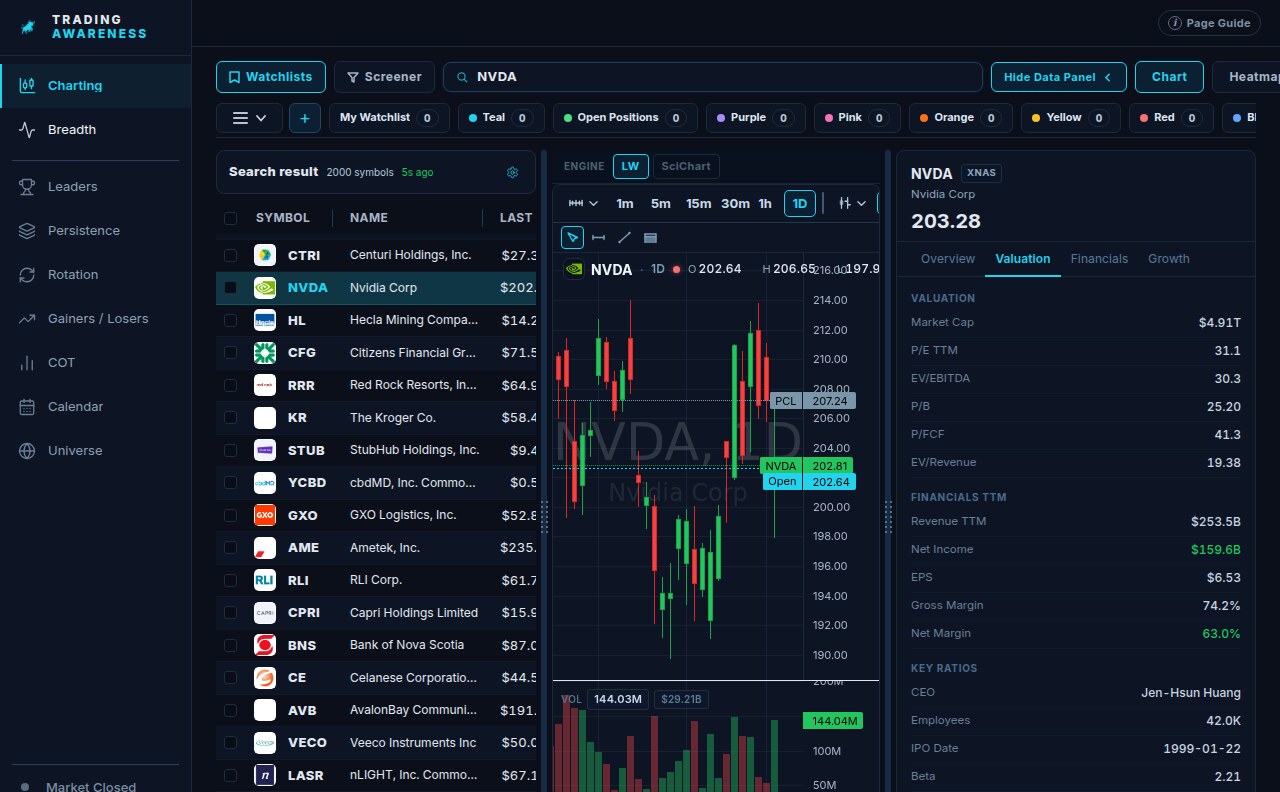
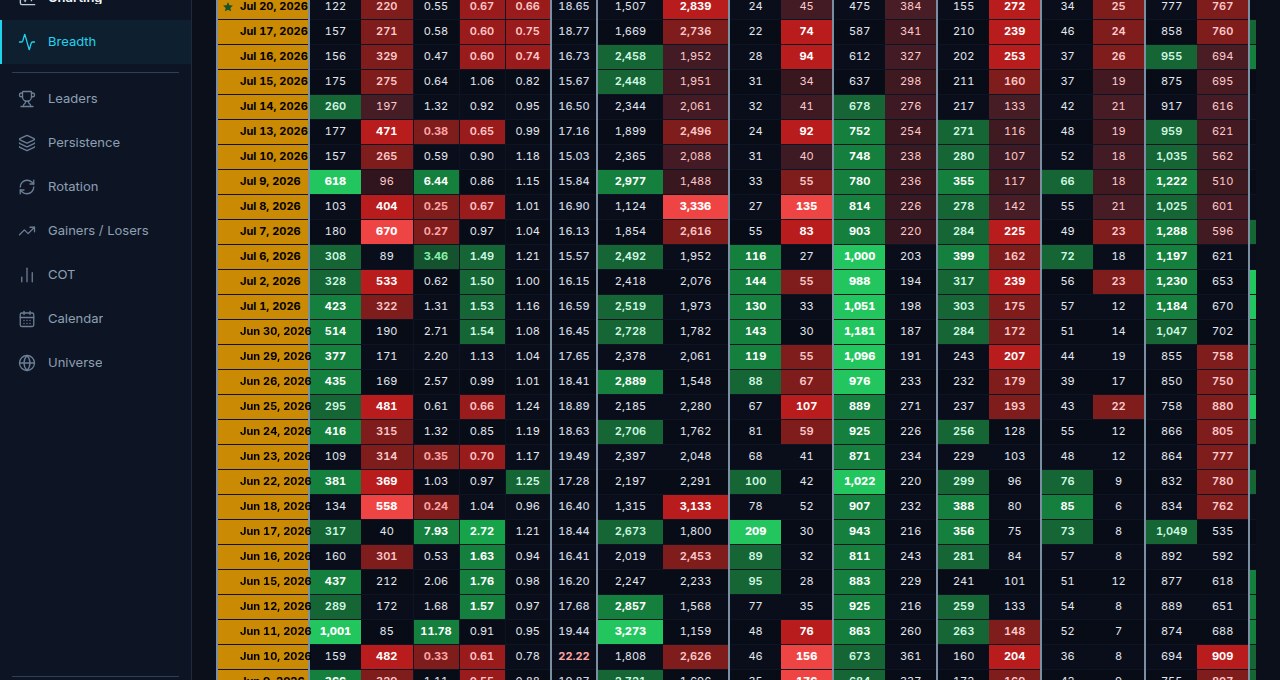
4% movers, 20%-in-5-days bursts, and leadership scores across ~12,000 stocks — StockBee-style breadth with Minervini/Qullamaggie-inspired ranks.
Why breadth
The index is lying to you.
The S&P can print green while 60% of stocks sit below their 50-day. Price tells you what happened to that stock. Breadth tells you what the other 11,999 are doing. Without both, you're trading with one eye closed.
Without WideRadar
× Index-level blindness — the S&P is green while most stocks are below their 50-day. You find out when positions stop working.
× Blind to rotation — you see which sector led after the move is already done.
× Breadth in five browser tabs — a Finviz strip, a StockCharts scan, a fundamentals site.
× No regime memory — is 41% above the 50-day bullish or bearish? You have no idea.
With WideRadar
✓ 12,000-stock participation — every signal across the full US tape, not 500 large caps.
✓ Live leadership & rotation — watch the money move as it happens.
✓ One dashboard — breadth, rotation, leadership, charts, and fundamentals in one place.
✓ Historical context — today's reading against 20 years of comparable regimes.
Charting & breadth in action
Analyze charts & verdicts
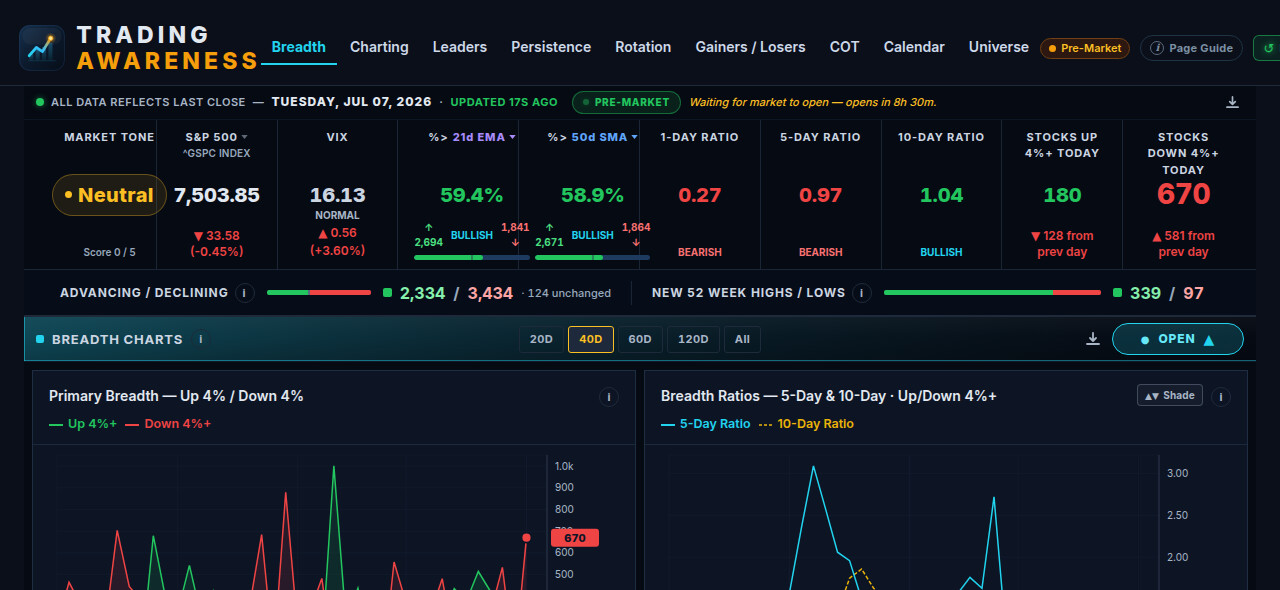
Switch between watchlists, built-in screens and themed lists, then click any ticker for a live candlestick chart with a full technical indicator suite. Get a buy / sell / partial / hold verdict, company profile, earnings history and key financials — all without leaving the page.
- RSI, MACD, Bollinger Bands, PSAR, ADX, OBV, ATR, Stochastics and more — every indicator period and colour customisable
- Rules-based buy / sell / partial / hold verdict scored from trend regime, RSI, ATR extension, MA position and volume
- Full fundamentals on every chart — P/E, EPS, Revenue, Gross Margin, ROE and earnings history to confirm the setup holds up
Read StockBee-style breadth
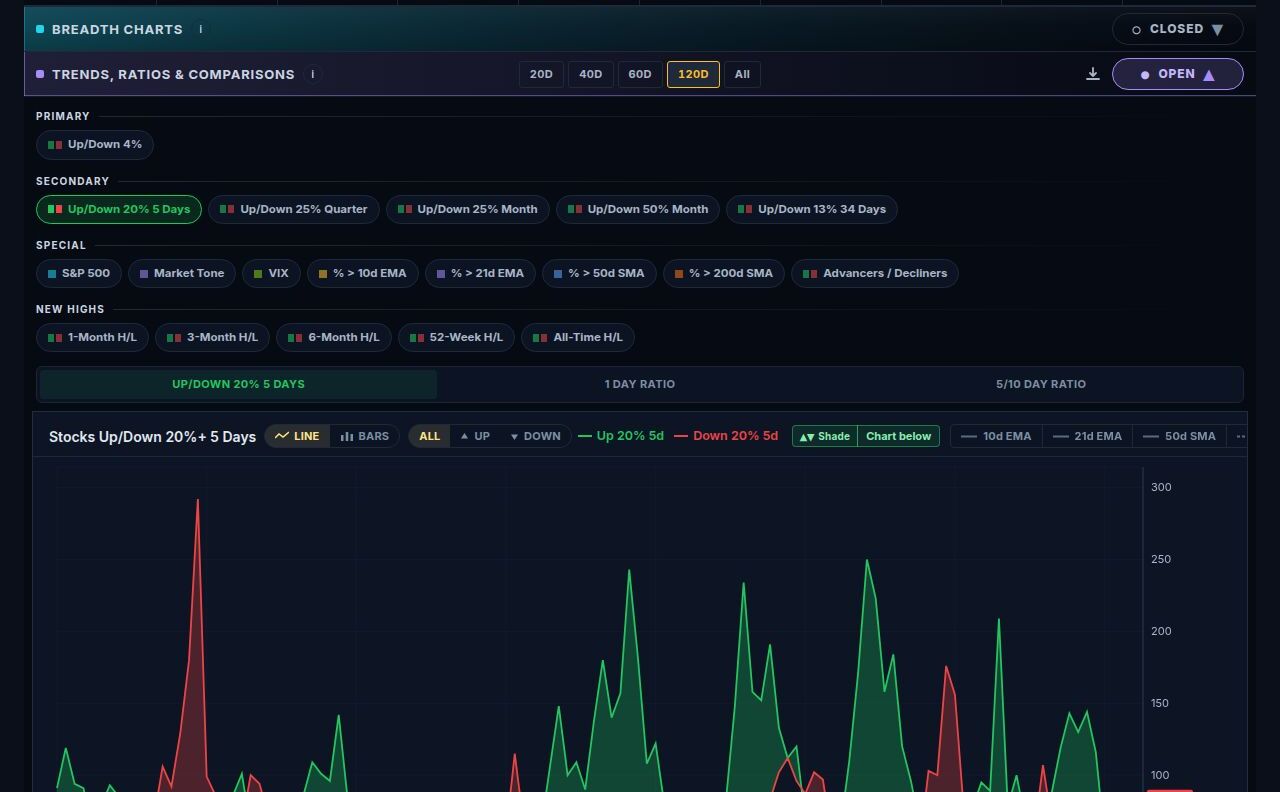
Pick any column — 20% moves in 5 days, 25% in a quarter, 50% in a month — and chart it back through 20 years of history. Overlay it on the S&P 500 to see exactly how breadth led every turn.
- Every StockBee primary & secondary column, one click away
- 5/10-day ratios, % above key moving averages, new-high/low spreads
- 20D / 40D / 60D / 120D / all-time ranges with S&P overlay
Who it's for
Built for traders who want the full tape — not another tip service
You'll get value if you…
✓ Swing or momentum trade US stocks and want a daily environment read
✓ Already watch breadth, leaders, or StockBee-style 4%/20% move counts
✓ Want charts + fundamentals + market internals in one workspace
It's not for you if you…
× Want someone else to tell you what to buy
× Only need a simple watchlist and a single chart
× Trade futures/FX exclusively (this is a US equities dashboard)
Morning routine
From open to entry in three steps
Value check
One plan. Real-time included.
| Plan type | Typical / mo | Real-time US equities | Full-tape breadth | Fundamentals |
|---|---|---|---|---|
| Premium research suites | ~$150 | Often included | Proprietary lists | Usually included |
| Scanner platforms | ~$120+ | Often included | Scanner-led | Varies by plan |
| Social charting apps | ~$70+ | Often + exchange fees | Not the focus | Usually available |
| Desktop charting tools | ~$50+ | Sometimes an add-on | Varies by plan | Usually available |
| All-in-one research apps | ~$49 | Often included | Research-focused | Usually included |
| WideRadar | $39 | Included | 20y · ~12k stocks | On every chart |
Illustrative only — typical public list prices for common retail plan tiers as of mid-2026. Individual products vary; features and fees change. WideRadar is one Pro plan with real-time included.
Your edge
Momentum-burst breadth across the whole US market
4% movers, 20% in 5 days, and new highs/lows — tracked across ~12,000 stocks with 20 years of history. StockBee-style signals, built for the full tape.
Simple pricing
Start with a 14-day free trial — no charge until the trial ends.
Your price is locked for life. Whatever you pay when you join is what you pay for as long as you stay subscribed. When the list price goes up, everyone already subscribed keeps their original rate — no tiers, no renewal surprises.
Frequently asked questions
Is the market data live?
Yes. Quotes are sourced from Massive.com in real time during market hours. Daily breadth, history and end-of-day metrics use official consolidated data published after each session.
Is there a free trial?
Yes — every new subscription starts with a 14-day free trial. You won't be charged until the trial ends, and you get full access to every tab during the trial.
Can I cancel anytime?
Absolutely. Cancel in a couple of clicks from your account billing settings. You keep Pro access until the end of the period you've already paid for.
Which markets and stocks are covered?
NYSE, NASDAQ and AMEX plus the quality OTC tiers (OTCQB / OTCQX) — about 12,000+ US common stocks in total. The breadth universe is fully configurable via your filters, with up to 5 years of daily history.
Do I need an account to try it?
Yes. A free account is required to start your 14-day trial so we can securely manage your subscription and keep your settings in sync.
How much does it cost?
One simple plan: $39 per month or $349 per year (3 months free). Both unlock the entire dashboard — there are no tiers or hidden add-ons. Locked for life — a future price rise never touches an existing subscription.
Stop trading blind.
Start with the whole picture.
Charts, breadth, rotation and leadership — everything you need to read the market, in one place.
Start Your 14-Day Free Trial14-day free trial · Cancel anytime · You won't be charged until the trial ends